- Home
- Climate Change
- Energy Carbon Footprint
Energy Carbon Footprint - Renewable,
Alternative And Conventional Energy
The actual energy carbon footprint for each method of power generation is important to know for effective planning of future power supply.
And the figures for an energy generation carbon footprint are likely to stun some advocates of various alternative energy sources.

It is interesting to see claims out there about sources such as solar
energy claiming no carbon dioxide equivalent impact on the environment.
But the impact of solar energy is not small. Or at least from photovoltaics. Within photovoltaics themselves there are big differences in the way they are produced. Some highly popular early sources take several years of energy generation to even begin to pay back their manufacturing effects.
Sure it is much less than oil and coal technologies. But it is not the cleanest alternative energy source by a long way.
Tabular Information
Following is a table resulting from some studies on effective carbon equivalents generation. It comes from several sources although the main one was the University of Sydney, Australia study undertaken in relation to studying the influence of nuclear energy.
| Carbon Footprint For Various Energy Generations (grams CO2 Equivalent/kWh) | ||||
|---|---|---|---|---|
| Energy Source | Sub Type | Generation Method | Carbon Equivalent | Carbon Range |
| Coal | Black | PF Fuel | 941 | 843-1171 |
| Supercritical | 863 | 774-1046 | ||
| Brown | 1,175 | 1011-1506 | ||
| General | 955 | |||
| Oil | 893 | |||
| Natural Gas | 599 | |||
| Turbine Open Cycle | 751 | 627-891 | ||
| Combined Cycle | 577 | 491-655 | ||
| Geothermal Power | Closed/low | 0-1 | ||
| Open/high | 91-122 | |||
| Nuclear Power | Light Water | 60 | ||
| Heavy Water | 65 | |||
| Hydroelectric | 15 | 6.5-44 | ||
| Concentrated Solar Power | 40 | 25-55 | ||
| Photovoltaic | 106 | 53-217 | ||
| Windpower | 21 | 13-40 | ||
| Biodiesel | Waste Grease | 125 | ||
| Soy | 383 | |||
Whole Life Energy Carbon Footprint
Of interest are figures for some renewable energies with their CO2 equivalents energy generation. This incorporates the whole process of producing the energy including that of building the units for power production.

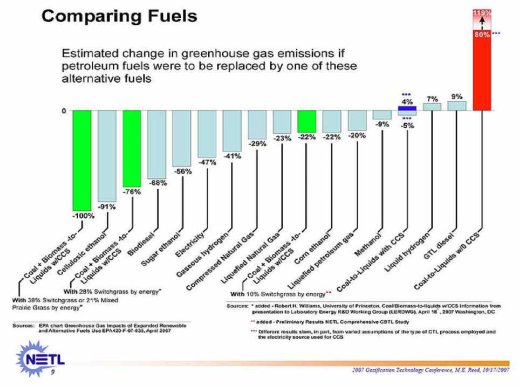
Graph Comparing Carbon Footprint of Gasoline to other Alternative Energy Sources from NETL part of US DOE through FPC
The calculations are standard across industries throughout the world.

Of interest in relation to this are studies done on actual carbon equivalents production compared to what is calculated as being produced.
Actual Measurements
Measurements at sites can vary considerably from published expectations. Why there is such a difference is obviously important to ensure we are dealing with reality - especially in future planning and requirements.
Even an alternative energy carbon footprint is worth knowing about in evaluating what would be our best power sources for the future.
- Home
- Climate Change
- Energy Carbon Footprint
New! Comments
Have your say about what you just read! Leave me a comment in the box below.